


When working on a project, it’s sometimes easy to get so involved in the work that you forget to keep an eye on the time and how everything else is tracking along. Thankfully, there are visual tools within the project management world that can assist in ensuring we’re on track to deliver the project within the required timeframe — like a burndown chart.
What Is a Burndown Chart?
A burndown chart is a visual representation of how quickly you and your team are working through — or “burning” through — your work. A handy tool for estimating when work will be completed, it is thoroughly used in the Agile methodology Scrum, but can also be used in other endeavours where progress is measurable over time.

Scrum, as we all know, is an Agile framework that aims to develop, deliver, and sustain complex products through collaboration, accountability, and iterative progress. The project management methodology encourages collaborative decision-making and constructive feedback so that a higher-quality product can be delivered efficiently. A burndown chart is a tool that can help achieve that.
Integrate agile frameworks with ease.
Sign up for free today!
Within the Scrum universe, there are two types of variants:
- Sprint burndown: the amount graphed is for the work remaining in the iteration
- Product burndown: the amount graphed is for the entire project
How Does a Burndown Chart Work?
The chart represents the work left to do versus time. The vertical axis often shows the outstanding work, or backlog, shown in whatever unit you desire (sprints, story points etc), and the horizontal highlights time. The idea is that the chart starts off with the greatest amount of outstanding work, and then it lessens throughout the project until it eventually burns down to nothing.
Creating a burndown chart isn’t a difficult task. Even if you’re not using a program that includes a burndown chart generator, it is fairly straightforward to create on Excel. And once you’ve created your burndown chart on Excel or another type of spreadsheet, you can, of course, import the data onto your Zenkit account and continue with the rest of your project.
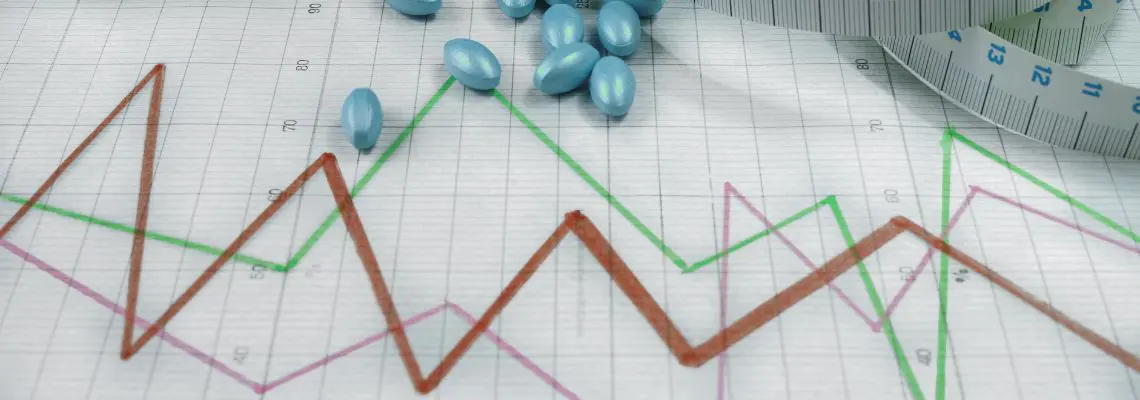
Burndown chart for a completed iteration example and how to read it (thanks to Wikipedia):

- Vertical axis: The outstanding work that needs to be completed for the project.
- Horizontal axis: The iteration timeline
- Start icon: The project start point that takes place on day 0 of the iteration. It’s located on the farthest left of the chart.
- End icon: The predicted last day of the iteration and located farthest right of the chart.
- Efficiency factor and the number of workers: This chart shows that there is an estimated 28 days of work to be done, with two developers working on the project who work at an efficiency of 70%. According to this, (28 ÷ 2) ÷ 0.7 = 20 the work should be accomplished in 20 days.
- Blue line: This represents the ideal work remaining. The start point shows the sum of the estimates for all the tasks that need to be done, and at the endpoint, the ideal line intercepts the vertical axis highlighting that there is no more work to be completed.
- Red line: This represents the actual work remaining. As you can see, while it starts off the same as the ideal work, the line fluctuates over time depending on the discrepancy between estimates and how effective the team is.
It is worth keeping in mind that the purpose of a burndown chart is to exhibit progress towards the end of the project and to predict the likelihood of when it will be completed. So, the above example is exactly that, an example, which is based on calculations that are founded on estimates.
Benefits of Using a Burndown Chart
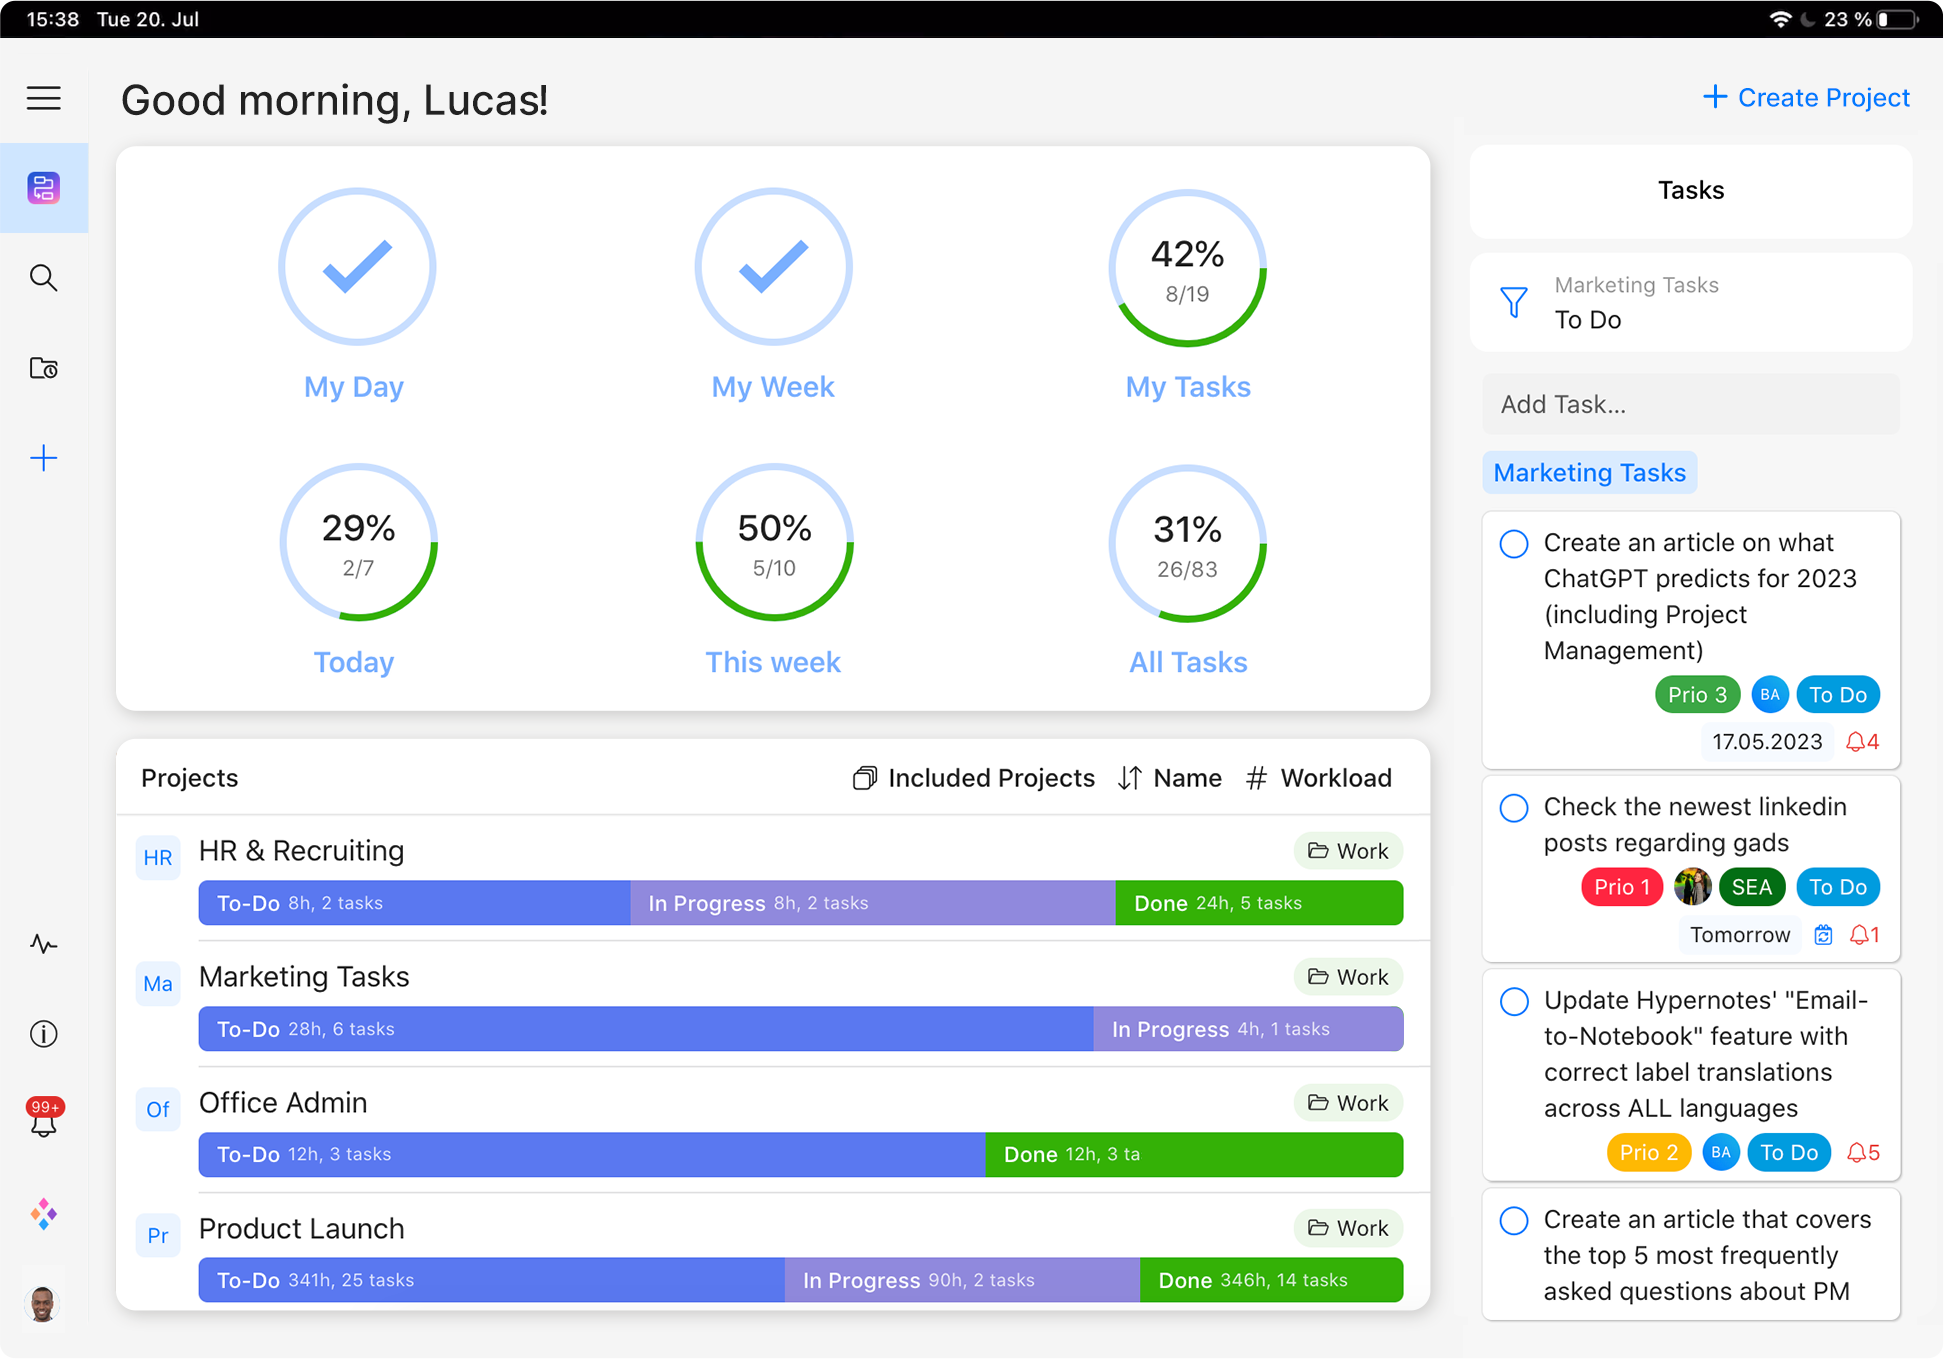
When it gets updated regularly, using a burndown chart offers your team an up-to-date status of the project. Having this kind of transparency means that any issues that may arise can be dealt with quickly, and being swift to rectify small issues can prevent greater problems from emerging later on in the project.
Like other agile visual tools such as a Kanban board, using a burndown chart gives you a visual depiction of the progress of your work, and can highlight whether your team is on track to complete the project on time. Having visual aids in the workplace can help us retain information better, as well as illustrate a point more effectively.
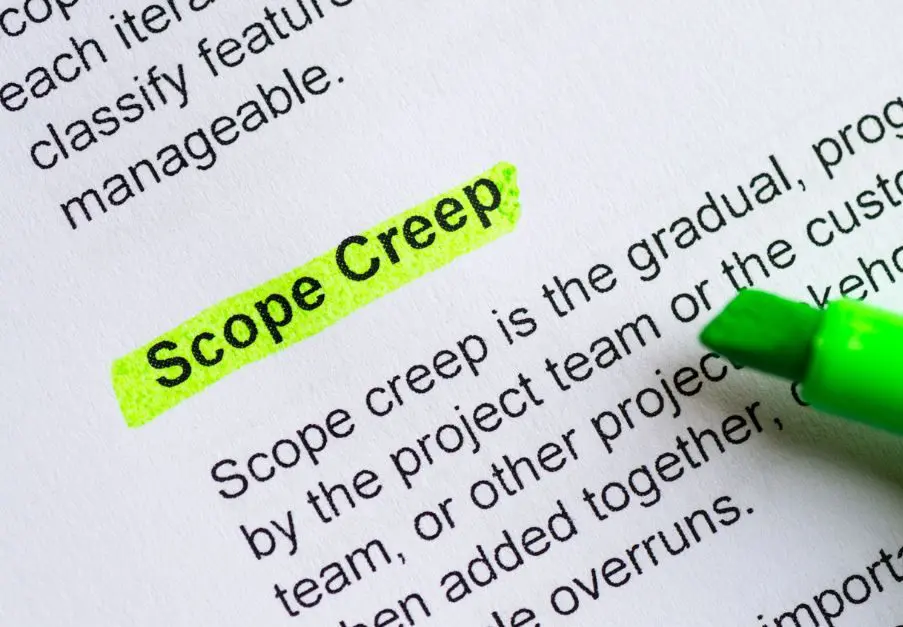
What you must remember is that a burndown chart cannot provide explicit details such as which product backlog items have been accomplished or where any changes that occurred within the scope of work had happened. They act as only an indicator of trends that is happening within your project.
Final Thoughts
Using a burndown chart offers a way for us to keep track of the progress of a project we’re working on so as to ensure we are on course to completing it within the required timeframe. As mentioned before, although unique to Scrum, it is not exclusive to it, so if you have any project on hand where progress is measurable over time, why not give a burndown chart a go? And if you do, don’t forget to tell us all about it.
Cheers,
Dinnie and the Zenkit Team

Leave a Reply