


Securing the smooth running and success of a project is no easy feat, but as a project manager, it’s your job to ensure it gets done. One of your biggest tasks is to make sure the project is delivered accordingly and on time because you’re fully aware of the consequences of what one minor task delay could have on the entire project.

Luckily, there are online scheduling tools that can make your job easier. Tools such as Gantt charts.
What Is a Gantt Chart?
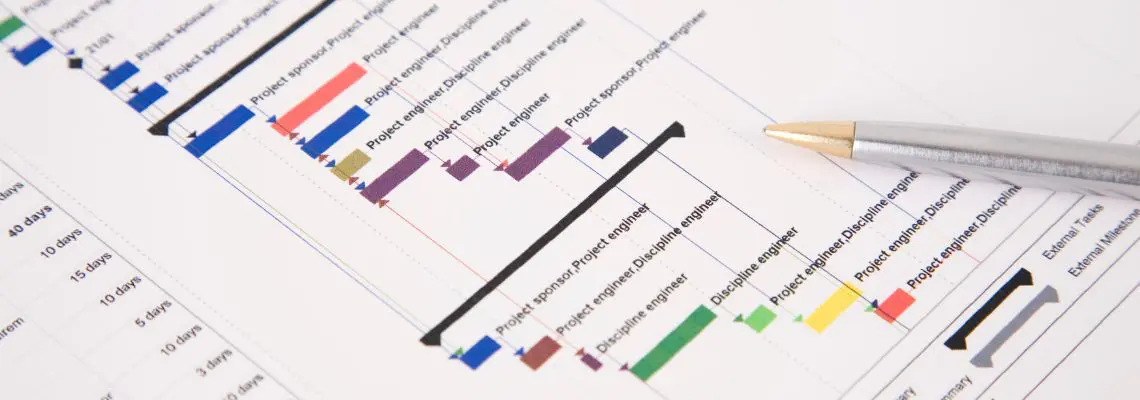
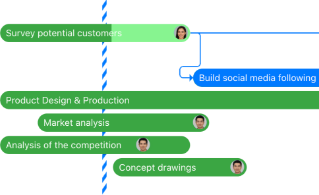
A Gantt chart is a bar chart that visualizes your project schedule. It uses a vertical task list against a horizontal time scale which is designed to highlight the work breakdown structure of a project and the relationship between the activities.
The first Gantt chart was created by a Polish engineer, Karol Adamiecki, in 1896. He published his diagram in 1931, which was called a “harmonogram”, only in Polish-speaking articles which is why it didn’t catch on in the English-speaking world.
Then along came American mechanical engineer, Henry Gantt, who designed and published a similar method around the same time. Due to his articles being published in English, it was this version that gained popularity in the West, and is the reason why we know it as a “Gantt chart” and not the “Adamiecki chart or harmonogram”. Gantt applied his chart to major construction projects such as the Hoover Dam.
Once personal computers became commonplace, software versions of Gantt charts started to appear. Initially intended for project managers, it eventually became a popular tool for anybody looking to adjust schedule changes and visualize their projects.

Why Is a Gantt Chart Important?
Gantt charts are an essential tool for project management. A great advantage of the planning process, it can help you figure out important details such as how long each task will take, who will be responsible for what, and anticipate any issues that may arise.
Another benefit of using a Gantt chart is that you can have all your project planning and tracking visualized. This can make it easier to report progress to stakeholders and customers. It can also help evaluate how much the project will cost, which is an important piece of information that many people may want to know.
As we all know, there are many things to consider when planning a project and using a Gantt chart can help you work out all facets of a project.
Online Gantt Chart Software vs Desktop
To appease modern project management needs, Gantt chart tools became available on desktop and online software.
Desktop Gantt charts are ideal for simpler projects. That’s because they often require a license per user, which can get costly if a project requires multiple user access. This is why online Gantt chart software is recommended for more complex and collaborative projects.
Online Gantt charts are designed to save you time and resources compared to their desktop counterparts. The ability to share content and invite multiple users makes it a preferred choice for project managers taking larger projects on board. The convenience and accessibility allow for better productivity and efficiency.
Excel Gantt charts are also popular. Users have the option to either create one from scratch or use a Gantt chart Excel template.
Gantt charts are suitable for any sized project. Your project doesn’t have to be as big as the Hoover Dam for it to be applicable. They are an online task management solution that tracks the details and progress of a project in one space, which is why it’s ideal for almost any team project.

Key Features of a Gantt Chart
A key indicator of whether your Gantt chart is shaping up to be a good one is that it must actually look like a Gantt chart. That means it should incorporate the time schedule, relationships, and progress updates of each task, in a bar graph format.
There are plenty of options when it comes to software, but the best Gantt chart template would include the following features:
1. Milestones
Milestones represent the vital moments in a project, such as a kick-off, deadlines, and reviews, that indicate how it’s moving along. They are fixed dates that cannot be changed without prior negotiation and authorization from the project manager. They are characterized by an eye-catching symbol and give you an overview of the important dates to keep in mind.
2. Task list
The task list is a list of tasks (obviously) that runs vertically on the left-hand side of a Gantt chart. It reflects the body of work involved in the project.
3. Timeline
The timeline on a Gantt chart runs horizontally and represents how long the project will run. It is usually made out in days, weeks, and months.
4. Drag & drop
Having a drag and drop feature will allow you to directly update your tasks and create links between them. The interactive function allows you to either make several changes in one place or just a single task at a time.
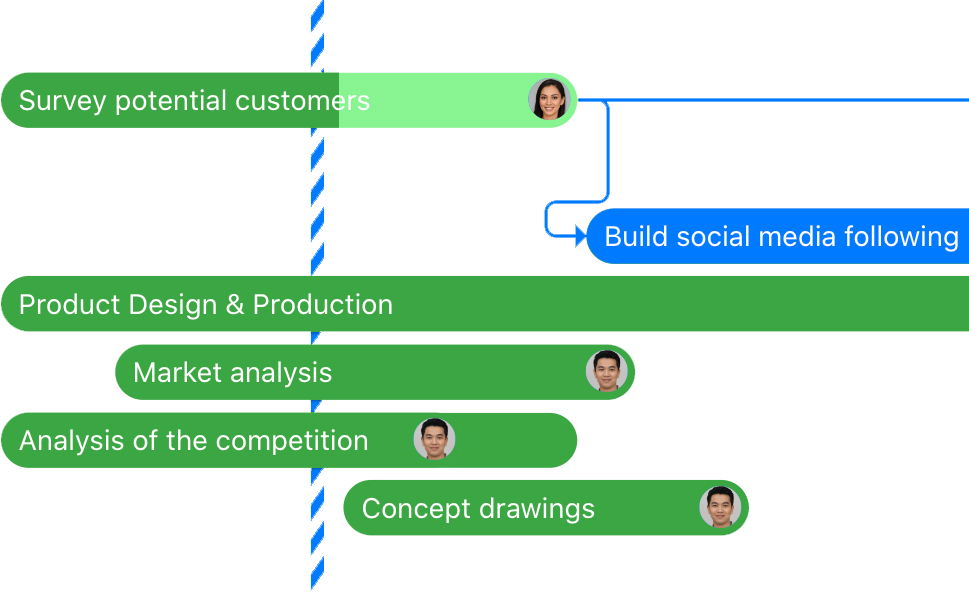
5. Dependencies
Task dependencies manage the relationships between your activities and set them up in sequential order. Your project, for instance, may require certain tasks to only be started when one has been completed and this feature ensures every task is scheduled for the process to run smoothly.
6. Critical path
A good online Gantt chart will allow you to determine the critical path of your project. A critical path highlights the shortest time in which your project can be completed. It is the connection between your most important tasks which must be done in order for the project to be a success.
7. Easy sharing
Online Gantt charts enable easy collaboration between you and your team members. Instead of having to save and send files as you would with a desktop Gantt chart, online software eases the process, allowing your team access to view and make changes to the project schedule.

Gantt Chart Best Practices
Using a Gantt chart can help you to keep your project on track. It can assist in managing time and costs, as well as resources and labour. To really get your team to achieve their project objectives, consider some of these best practice tips:
Include start and end dates
This may seem like a no-brainer, however, make sure your start and end dates for each task are in clear view. The transparency of these dates will serve as a constant reminder of how much time you have for each task. By sticking to the designated duration of each task, it will ensure your project is delivered on time.
Keep in mind work-free times
Don’t overlook work-free times when scheduling tasks for a project. Your team, and even yourself, will require some time off, especially if it’s a long-term project. Allocating time for vacation and breaks will ensure your project remains on schedule even if the timeline shifts.
Get creative
A Gantt chart is a visual project management tool, so be sure to make it exactly that! Take advantage of the customization options and colour code your project. Group together tasks and information that share a common ground. This can provide clarity and help your team identify the tasks they’re responsible for so they can take the appropriate action.
If your business has certain colours that it likes to use, such as branding colours, then it would be a great chance to use them. You could also simply use colours that have universal meanings attached to them, such as red for pause. If your Gantt chart software provides the option, select a milestone symbol that is familiar and that represents something of high importance to your team.

Don’t forget the details
The more details you include in your Gantt chart, the more your team will understand and can respond accordingly. Add as much information to each task as possible, such as step-by-step instructions and highlighting who the responsible individuals are. This will ensure accountability for work, and that progress can be easily tracked.
Final Thoughts
Whether it’s online or created in Excel, a Gantt chart is a valuable asset to have in your project management toolbox. It offers flexibility, transparency, and accountability, and makes your project more manageable — a must-have for any project manager!
We use Gantt charts in Zenkit to help keep us organized when planning our press and product releases. View switching is one of our favourite features while working on projects together. We’d love to hear your experiences when using Gantt charts in Zenkit for your projects. It will certainly help us to create the best feature possible.
Cheers,
Dinnie and the Zenkit Team

Leave a Reply