Finally see how to stop getting stuck in a project management tool
Book a Live Demo20 min. personalized consultation with a project management expert
Introducing Gantt View for Zenkit
Our most powerful tool yet for managing complex projects

Today, we’re proud to finally release our most requested feature ever. Since Zenkit was launched way back in 2016, our users have been requesting that we develop a Gantt chart or timeline view. We’ve been putting it off, not because we thought it was a bad idea, but because we thought it was so important that we had to do it right. We had to wait until the moment we were able to do it justice.
Now is that moment.
Over the years, we’ve learned a lot. Not just about building software, but also about project management and everything it entails. We feel that Zenkit the product, and Zenkit the team, is mature and experienced enough to manage the complexity involved in delivering the best Gantt view we could.
With the new Gantt view, we didn’t want to create just a simple timeline view of your tasks. We wanted to make sure we could deliver every feature you’d expect from a fully-fledged Gantt tool. This means that not only are your tasks displayed on a timeline, but that you can create 4 different types of dependencies between tasks, add lag and lead, create milestones, view the critical path, and even display one chart superimposed over another.
Let’s get into it!
Benefits of Using Gantt
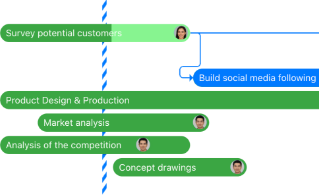
Zenkit started life as a Kanban tool – the increasingly popular project management methodology used by teams of all sorts around the world. Like Kanban, Gantt is a way to track and manage projects. The main difference between Gantt and Kanban is that Gantt gives you a more structured, granular overview of the project schedule, while Kanban focuses primarily on the progress of tasks. This means that you can precisely track the start and end dates of activities, whether or not an activity is dependent on another, the resources needed to complete them and much more. Unlike Kanban, Gantt charts give a clear and easy to understand visual representation of the project timeline, enabling you to understand your project schedule and resources at a glance.
Gantt charts were commonly used in long term, complex waterfall projects that involve physical resources and multiple teams of people, particularly in industries like construction, manufacturing, engineering, infrastructure, IT, and more. Now, with the help of software (like Zenkit!), you don’t need years of special training as a project manager to manage complex schedules and task lists. Almost anyone can create a Gantt chart if they think it would help their project!
Introducing Gantt View for Zenkit
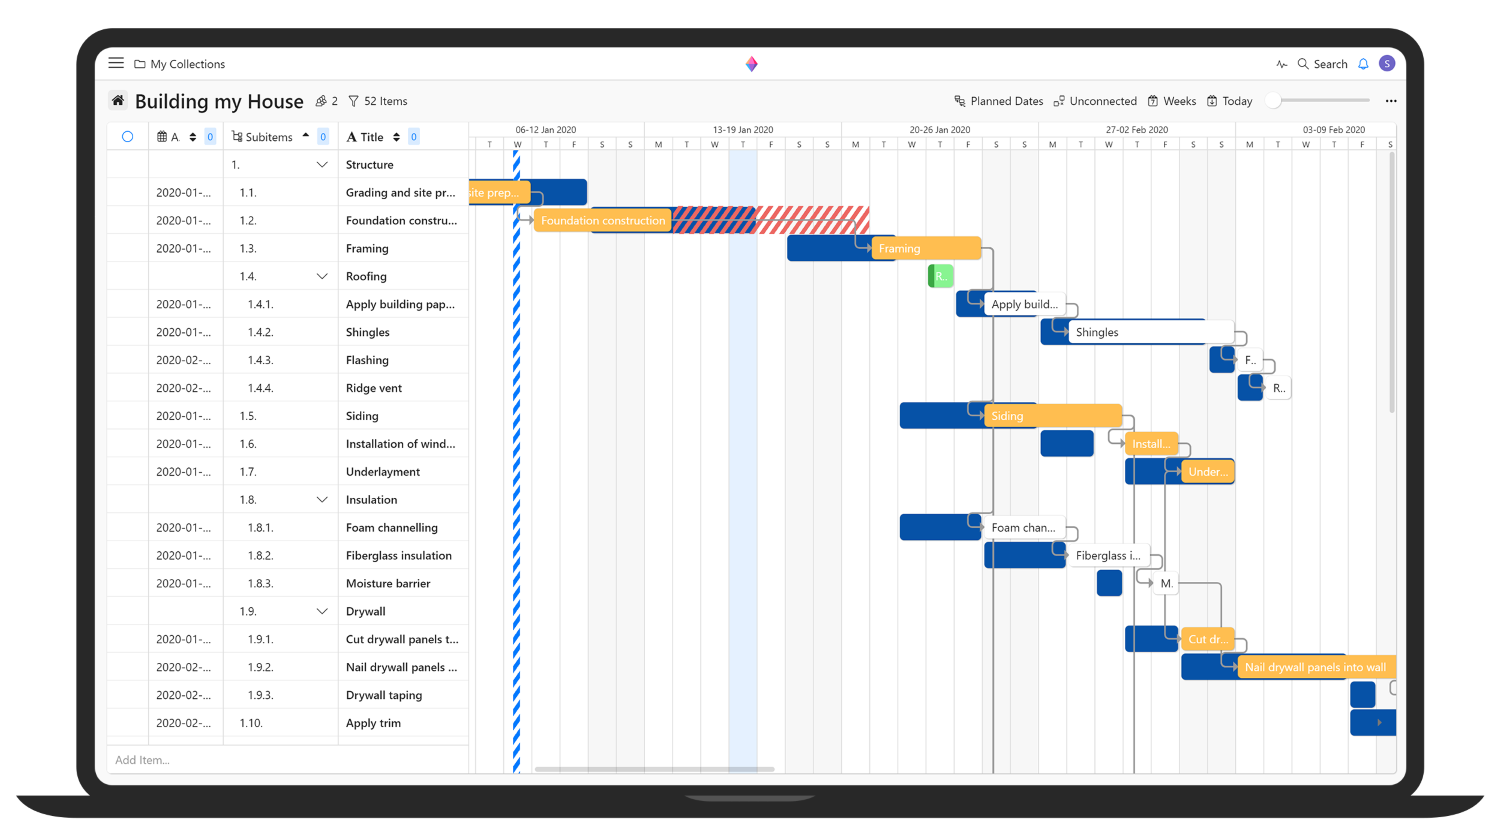
Gantt View is rolling out to Plus and Business users today! Here, I’ll cover the main functions of the view, but of course, as always, you can learn more about it in our Gantt View documentation.
Dependencies
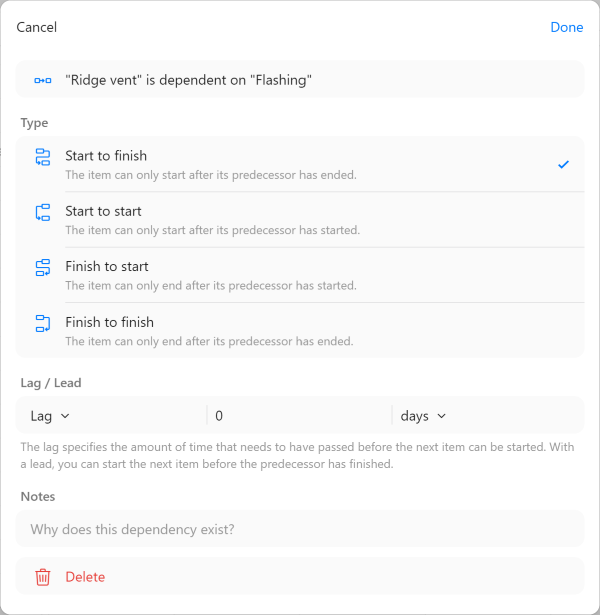
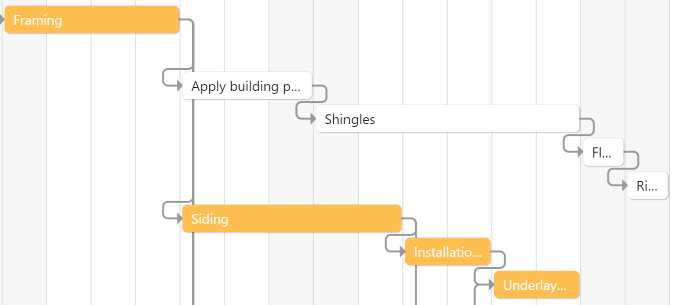
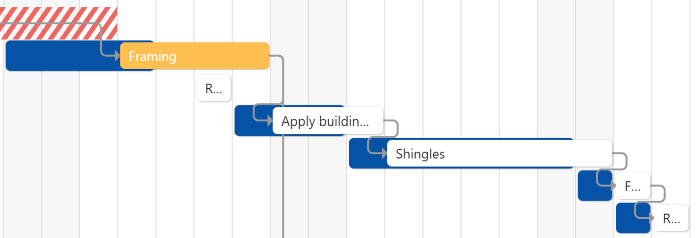
You can create dependencies between scheduled items by dragging and dropping an arrow between the tasks on the chart. Click on the arrow to change the dependency type, add a description of the dependency, or add lag and lead.
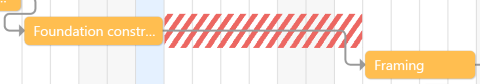
Critical Path
The critical path shows the items in your chart that determine the minimum time needed to complete the project. If any item on the path is delayed or takes longer than expected, the project will be completed late. When the critical path is activated, the items on the path appear in orange.
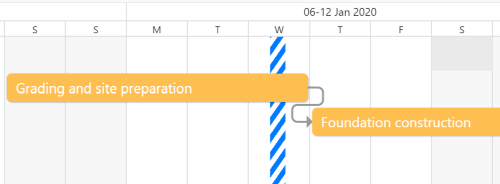
Lag and Lead
Lag and lead allow you to add delays between tasks, or allow a task to start earlier than scheduled if there’s no clash of resources. This function is available only to Zenkit Business users. Lag is indicated in red, lead in green.
Milestones
Milestones are used to indicate important points in a project. Usually the start and end of a project are marked, as well as the completion of important phases, and appointments such as external review or auditing, or budget checks. Zenkit displays milestones clearly with a blue horizontal line.
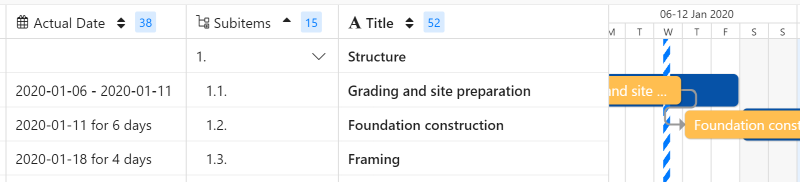
Secondary Date
In some instances, it may be helpful to show one Gantt chart superimposed on top of another, for example, a chart that tracks the actual dates of your project on top of the originally planned dates. In Zenkit, this can be done by creating a second date field and opting to display it on the chart via the Gantt view options. This is available only to Business Plan customers.
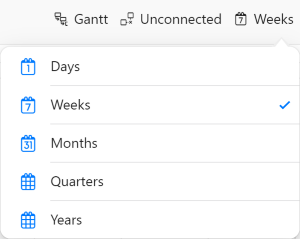
Breakdown by Time Period
If your project is very long, it wouldn’t make any sense to view it on the scale of days or weeks. In fact, it may make more sense to view it in months or even years! Zenkit lets you change the scale of the chart, as well as zoom in and out along that scale.
Drag & Drop
Drag items onto the chart, move to re-schedule or drag the edges to change the duration of tasks. You can even drag and drop to change the hierarchy of tasks and subtasks! It may seem pretty basic, but it makes working in Gantt just that little bit more delightful!
We’re extremely proud of Zenkit’s Gantt view, and hope we’ve been able to do it justice! Do you use Gantt charts in your projects? What do you think of our latest view? As always, we’d love to hear your feedback. Please feel free to leave a comment here or contact our team to let us know!
Cheers,
Siobhan and the Zenkit Team
FREE 20 MIN. CONSULTATION WITH A PROJECT MANAGEMENT EXPERT
Wanna see how to simplify your workflow with Zenkit in less than a day?
Book a Live Demo
So weit ich das bis jetzt beurteilen kann, funktioniert Gantt bei euch super! Danke für die tolle Umsetzung! Mich stört nur eine Sache: hat man Sub-Items angelegt und es ist mindestens eines erledigt, wird das Ursprungs-Item mit einem grünen Fortschrittsbalken überlagert, welcher auch die ursprüngliche Farbe des Ursprungs-Item in der Gantt-Ansicht überlagert. Ich habe nirgendwo eine Einstellung finden können um das zu deaktivieren. Übersehe ich was, oder kann man das nicht deaktivieren? Wenn dem so ist, bitte nachreichen!
Und vom Handy bedient ist die Gantt-Ansicht zu anfällig den Balken und somit das Datum zu verschieben, eine Möglichkeit das Verschieben zu deaktivieren wäre toll!
So weit ich das bis jetzt beurteilen kann, funktioniert Gantt bei euch super! Danke für die tolle Umsetzung! Mich stört nur eine Sache: hat man Sub-Items angelegt und es ist mindestens eines erledigt, wird das Ursprungs-Item mit einem grünen Fortschrittsbalken überlagert, welcher auch die ursprüngliche Farbe des Ursprungs-Item in der Gantt-Ansicht überlagert. Ich habe nirgendwo eine Einstellung finden können um das zu deaktivieren. Übersehe ich was, oder kann man das nicht deaktivieren? Wenn dem so ist, bitte nachreichen!