


If you use Zenkit Hypernotes, you may have already come across the Knowledge Graph feature after having created content in your Notebook.
For those who don’t know, or are in the midst of exploring Hypernotes, the Knowledge Graph is a very powerful tool for working with your knowledge.
It allows you to focus in on specific topics, discover connections between disparate ideas, quickly connect pages with references, & even create new pages that are already linked to several others.
Naturally, such a feature-rich view might take some getting used to. As such, we’ve broken it down into manageable segments so that you can maximise your understanding & begin cohesively capturing your knowledge.
Zenkit Hypernotes
Hypernotes is a note-taking app that aims to improve your knowledge management by allowing you to create, share, & understand knowledge in a completely new way.
It is intended to be used for any writing task, including wikis, intranets, documentation, book outlines, research, diaries, first principles, a personal Zettelkasten, & so on.
This means that it can be used by almost anyone, & the variety of plans makes it available to everyone from students, NGOs, & freelancers to SMBs & large enterprises.
The Purpose of a Knowledge Graph
A knowledge graph, also known as a semantic network, is a type of knowledge base that integrates data using a graph-structured data model or topology.
The graph depicts the relationship between real-world entities, such as objects, events, situations, or concepts, by illustrating the network that connects them.
When data is linked, a framework for data integration, unification, analytics, & sharing is created.
The Importance of the Knowledge Graph
First & foremost, it’s important to note that there are many forms of knowledge graphs. A quick Google search will show you that the most popular are linked with machine learning. However, Zenkit Hypernotes’ Knowledge Graph is not as complicated as that.
Instead, its Knowledge Graph simply acts as a safe space to capture thoughts, ideas, or concepts onto a visual & fluid working platform.
This particular type of Knowledge Graph is important for knowledge capture & visual management. By capturing your thoughts in your Notebook, you are able to visualise the connections between them via the Knowledge Graph. This allows for a deeper understanding of your work to come to light as well as new avenues to explore once everything has been successfully mapped out.
Plus, it’s an intuitive tool when working in a team. Due to its built-in task management features – including task creation, notifications, & comments – the Knowledge Graph becomes an exciting platform to advance project work by giving everyone a continuous overview of the flow of the work being carried out.
In the end, the Knowledge Graph is an invaluable resource that makes finding connections between ideas an intuitive, visual experience. Using a tool like this can help you to make connections between ideas that you never thought could be related, sparking yet more ideas, better writing, & a better-informed worldview.
A Break Down of the Knowledge Graph
The Knowledge Graph in Hypernotes is directly linked to your Notebook. Whatever work you produce in your Notebooks can be automatically converted into the Knowledge Graph to better visualise your work & see how everything is connected.
From the Knowledge Graph, you can create new pages & toggle the connection between them more fluidly. Plus, as previously mentioned, it also has built-in task management, meaning that you can develop larger projects more coherently either by yourself or with a team.
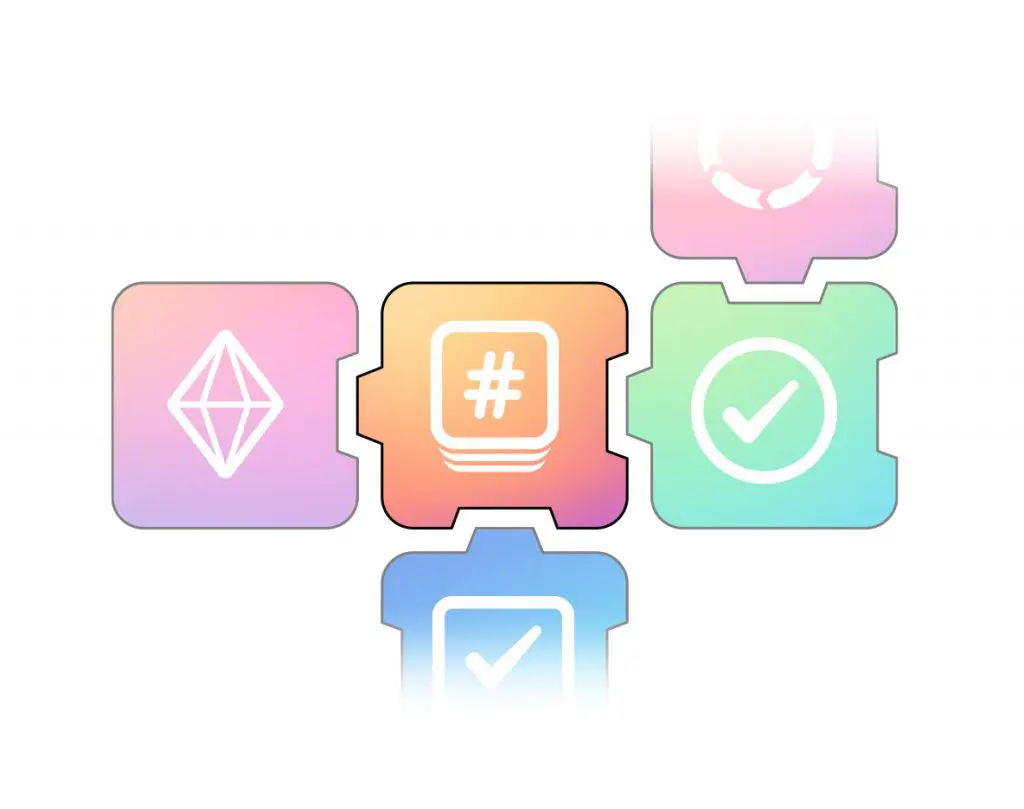
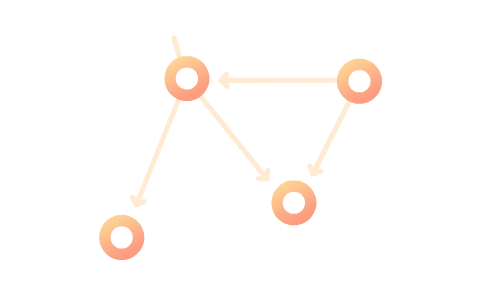
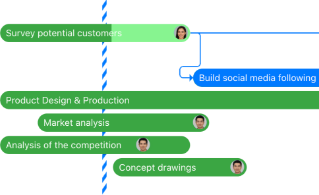
The Knowledge Graph is made up of three main components: nodes, bi-directional links, & colour-coded labels. Any object, idea, or concept can be a node & a bi-directional link shows the relationship between them. For example, a node could be a product, like Hypernotes, & a concept, like the Knowledge Graph & a bi-directional link, would illustrate that the two are connected.
It is worth mentioning here that, due to the interchangeability between the Notebook & the Knowledge Graph, the ‘Pages’ that you create within the Notebook are represented as ‘Nodes’ in the Knowledge Graph.
There are numerous components that contribute to the Knowledge Graph’s intuitive & powerful nature. As such, we’ve broken down some of those elements below to give you a better understanding of how the Graph works.
Nodes
As previously mentioned, Nodes are the ‘Pages’ created in your Notebooks when placed onto the Knowledge Graph. Each Node act as a cell full of information & captured knowledge that can be accessed with a simple click.
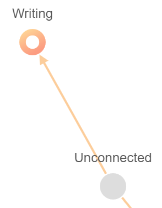
When you create a new Page in the Notebook & switch to the Knowledge Graph, you’ll see that the Node representing that Page is unconnected from the rest of the graph. It will remain detached until you connect it to other Nodes through either referencing or by drawing a line from it to another.
Referencing
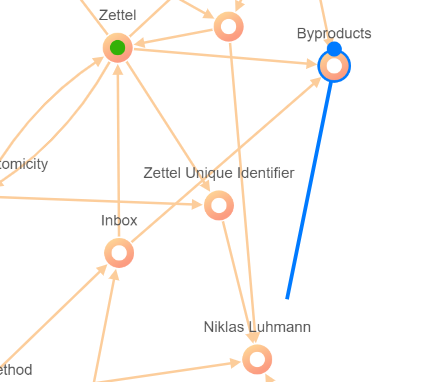
The Knowledge Graph is an easy way to link notes with one another. Even though all references within Hypernotes are bi-directional, the arrows between nodes on the Graph signify which note directly mentions another in the note text.
Linking pages in this way will cause them to appear in the mentions section of the linked pages, even though no text inside each of the pages directly references or mentions the other page.
Adding a reference from the Knowledge Graph is very straightforward. Simply hover over a node & click & drag the blue dot that appears to another node you want to reference to connect them.
Colour-Coding
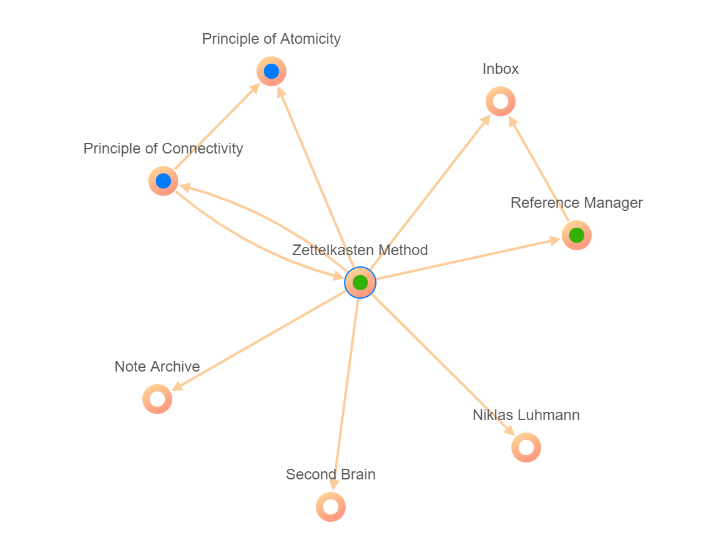
Here we can see blue, green, & neutral coloured nodes (meaning no action has been registered to it).
The colour-coded Nodes in the Knowledge Graph are one of its most creative (& colourful) features.
Colour-coding isn’t just for decoration. Instead, it’s a fantastic way to easily manage & visualise the goings-on of your graph & all its collected data.
- Red – These Nodes indicate that there’s a new notification. This is a popular feature when working with a team on the same Notebook. Notifications could indicate anything from a change made on a page, to a new member being added to your project.
- Green – This highlights when a Node/Page has an open task that needs doing. Once all tasks linked to that particular Page has been completed, the Node will return to its neutral white colouring.
- Orange – Orange means that this particular Node has been starred & placed into the favourites section for quick & easy access.
- Blue – This coloured Node denotes that there are new comments to be read. This helps to enhance the experience of team collaboration.
- Pink – Pink Nodes are those that have been collapsed to help see the connection with more distant Nodes, ideas, & concepts.
You can access the legend explaining the meaning of each from the information menu in the lower left-hand corner of your screen.
Final Thoughts

The Knowledge Graph is a vast & ever-growing knowledge base. The more you add to it, the more powerful it becomes & the more benefits you begin to reap as a result of it.
Whether you’re working on a solo project or with a team, we hope that the Knowledge Graph has proven (or will prove) to be a viable tool for bolstering your work!
What are your thoughts about the Graph?
Feel free to visit our Knowledge Base to learn even more about Hypernotes.


Leave a Reply